Formion Gold FRVP: What a 57.1% Win Rate Actually Tells Us

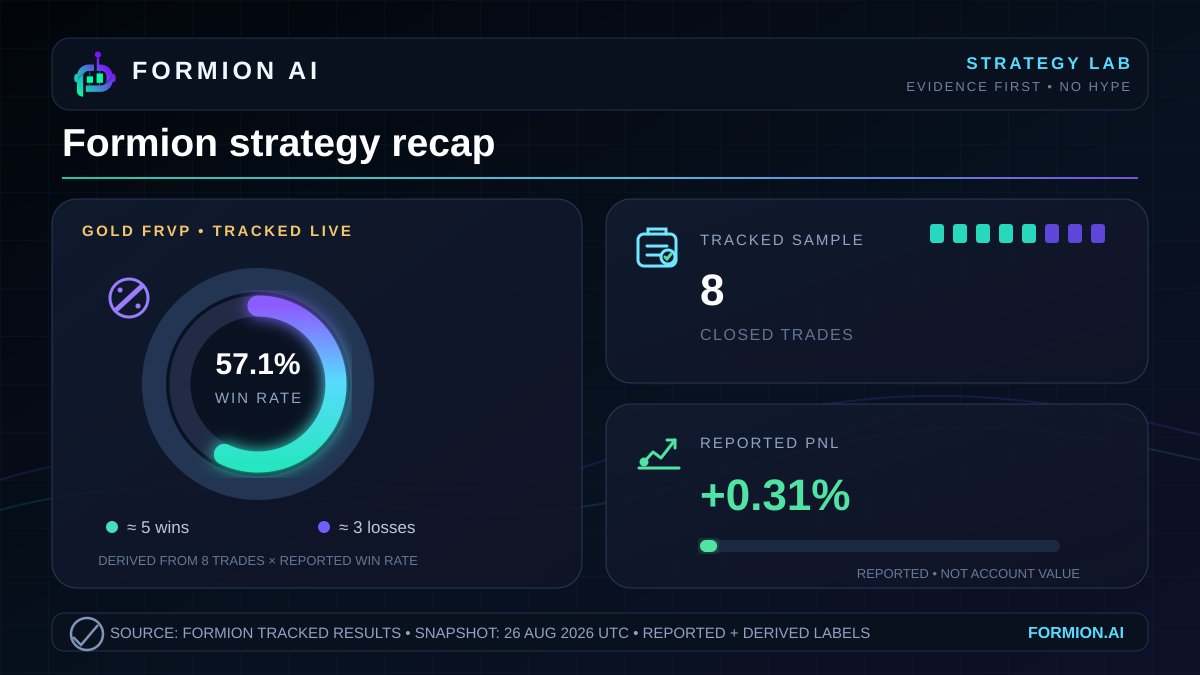
A win rate tells you how often a strategy wins. It does not tell you how much those wins are worth. That distinction matters in Formion’s tracked results for November 21, 2026: Gold FRVP reported a 57.1% win rate alongside 0.31% PnL, or profit and loss expressed as a percentage. Meanwhile, the supplied market snapshot showed substantially larger gains among selected assets.
The strategy’s reported result was positive, but modest. Understanding that combination requires separating trade frequency, financial outcome and market context. Each answers a different question. Treating them as interchangeable can make a restrained result look stronger than the evidence supports—or make a positive result look weak against a comparison that was never appropriate.
Gold FRVP: reported performance in context
A winning trade is not a unit of profit
Win rate normally means the share of evaluated trades classified as winners. It counts outcomes, rather than measuring their size. A small profitable trade and a much larger profitable trade can each count as a win.
PnL measures the financial result. When shown as a percentage, it also depends on a denominator: the capital or other reference amount against which that result is calculated. Without knowing that reference amount and the measurement period, a percentage cannot fully explain the account’s performance.
These distinctions are practical. A strategy can win frequently yet lose money if its losing trades are large enough. It can also win less frequently and finish profitable if its gains outweigh its losses. Neither pattern is established for Gold FRVP by the supplied figures. They explain why win rate alone cannot establish the quality of a strategy.
Gold FRVP’s reported win rate and positive PnL are therefore complementary observations. They are not enough to reconstruct how the result was achieved.
Reading the Gold FRVP result carefully
The tracked-live record supplied for Gold FRVP contains 8 trades, a 57.1% win rate and 0.31% PnL.
The first limitation is in the relationship between those fields. The reported win rate does not map cleanly to an integer count of winning trades if every reported trade belongs to the same evaluated set. That does not establish an error. It establishes that the definitions needed to reconcile the figures are missing.
The supplied facts do not explain which trades enter the win-rate calculation or how trade status affects inclusion. Consequently, the responsible summary preserves the reported figures without translating them into a specific number of winners and losers.
The second limitation concerns the PnL percentage. The facts provide no measurement window, return denominator, starting capital or current account value. They also do not specify whether the result includes fees or unrealized positions—positions whose gains or losses have not been locked in by closing them.
That leaves a narrow but useful conclusion: Gold FRVP reported a positive percentage PnL. It does not establish a daily account return, a cash profit or a return on a known starting balance. Current account value, even if it were available, would be a different measurement from the capital base used to calculate a window return.
A worked reading, without invented trades
Consider how a trader might interpret this snapshot.
Start with the win rate. The reported 57.1% indicates that winners made up more than half of the outcomes included in that calculation. Stop there. It does not establish the average gain, average loss or reliability of future results.
Next, read the 0.31% PnL as the reported financial outcome under the tracker’s calculation. It is positive, but it supplies no evidence of a large gain. Pairing it with the win rate does not reveal whether the result came from broadly similar trades or a few outsized contributions.
Finally, consider the 8 trades as the reported activity count. This is a limited record for assessing repeatability. The snapshot does not show a longer performance history or whether the strategy has behaved similarly under different market conditions.
The worked conclusion is deliberately restrained: Gold FRVP reported a modest positive result and a majority-win rate within its evaluated set. The data does not establish a durable advantage or explain the distribution of trade outcomes.
The market moved more, but the comparison has limits
The day’s supplied market context featured  SOXSB, up 21.98% over the reported 24-hour period at $81.18;
 RARE, up 18.76% at $0.01418; and
 ENSO, up 9.35% at $0.456.
Those reported moves are much larger than Gold FRVP’s reported PnL percentage. That numerical contrast is visible. Calling it strategy underperformance would require more evidence.
A benchmark is a reference used to judge performance on a comparable basis. These assets are listed as notable movers, not as Gold FRVP’s holdings, trading universe or benchmark. Their reported price changes cover a stated period; the strategy’s supplied PnL does not have a stated window.
The selection also cannot establish market breadth, meaning how widely gains or losses are spread across the market. Strong moves among selected assets show that those assets advanced. They do not prove a broad rally or show how accessible those gains were to the tracked strategy.
The honest recap leaves both observations intact: selected assets posted strong reported gains, while Gold FRVP recorded a modest positive reported PnL. Neither observation explains the other. These are tracked results with unresolved measurement details, not promises.
- Gold FRVP reported 8 trades, a 57.1% win rate and 0.31% PnL
- Win rate counts outcomes; it does not measure the size of gains and losses
- The supplied figures do not establish the PnL window, return denominator or winning-trade count
- Selected market movers provide context, not a matched strategy benchmark
Explore Formion at app.formion.ai.
Trade these setups — don't just read about them.
See these signals live in the Formion trading terminal.
- Free to start
- No card required