Crypto movers show selective strength, not broad risk appetite

The Binance  USDT market snapshot for November 17, 2026 shows a sharp advance in
 HUMA alongside smaller gains elsewhere and a separate group of declining instruments. The spread of outcomes is consistent with selective risk-taking, but a leaderboard alone cannot establish that appetite for crypto risk has strengthened across the market.
Strength and weakness across the reported movers
The distinction matters because the strongest percentage move and the largest reported trading volume belong to different instruments. Price change describes the outcome of trading over the window. Volume describes reported trading activity. Neither, on its own, identifies who traded, why they traded, or whether their activity represents a lasting change in market preferences.
The numbers
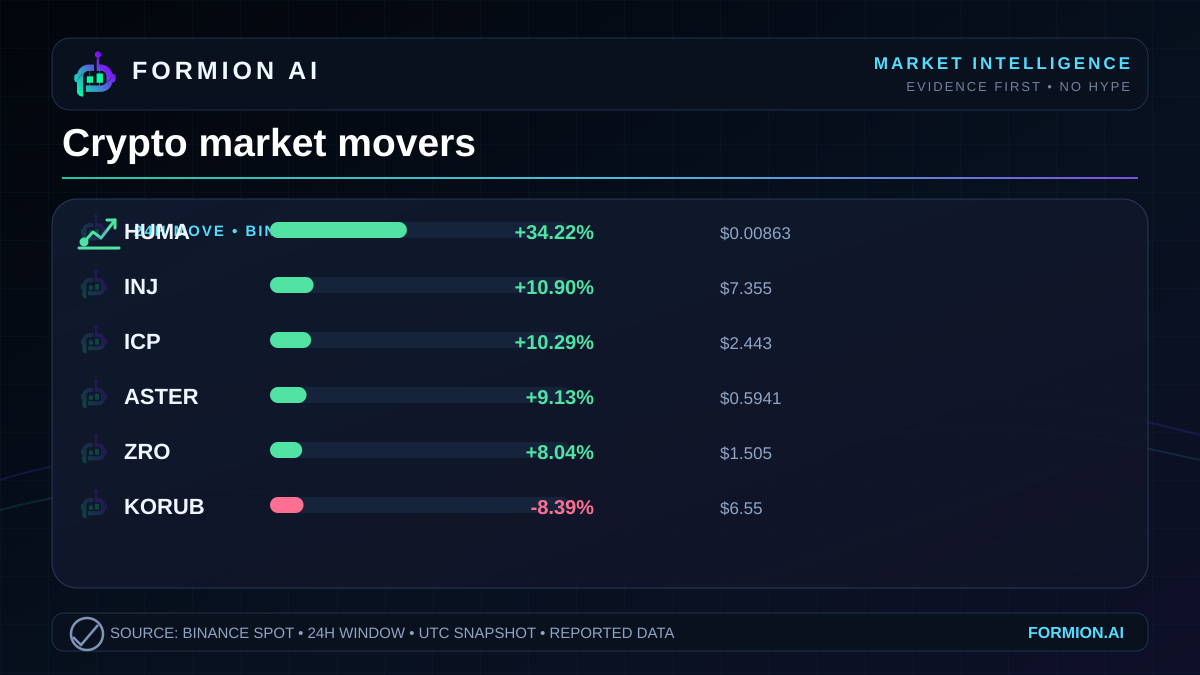
These are the supplied top gainers and losers for the reported Binance USDT window. Last prices are snapshot observations, not executable quotes or reference levels for future trading.
| Symbol | 24h change | Last price |
|---|---|---|
| HUMA | +34.22% | $0.00863 |
 INJ | +10.9% | $7.355 |
 ICP | +10.29% | $2.443 |
 ASTER | +9.13% | $0.5941 |
 ZRO | +8.04% | $1.505 |
 KORUB | -8.39% | $6.55 |
 SNXXB | -6.79% | $3.02 |
 SOXLB | -5.33% | $50.49 |
 INTCB | -4.61% | $54.78 |
 PUMP | -3.76% | $0.002765 |
The selection captures the extremes of the supplied ranking. It does not describe the typical instrument on the venue, the performance of a broad benchmark, or the proportion of the market that advanced.
A standout gain is evidence of dispersion
HUMA’s reported gain stands apart from the other advances in this snapshot. That establishes an unusually strong relative move within the supplied selection. It does not establish a market-wide change in sentiment.
Dispersion means the extent to which individual returns differ from one another. Here, the range of positive and negative outcomes makes a single description such as “the market rallied” inadequate. Some instruments appreciated sharply while others declined.
Risk appetite is the willingness to accept uncertainty in pursuit of returns. A broad increase would be more convincingly supported by widespread participation than by a prominent winner. The supplied data contains no market breadth measure—the share of instruments advancing—and no benchmark return against which to judge the leaders.
The defensible interpretation is therefore narrow: the snapshot shows concentrated price strength and meaningful differences between instruments. Selective risk-taking is a plausible reading of that pattern, rather than an observed fact about investor intentions. The data cannot distinguish a broad shift in confidence from isolated repricing.
Rotation requires a connection the ranking cannot show
Rotation describes a change in market preference from one asset or group towards another. A list containing both gainers and losers can look like evidence of rotation, but simultaneous moves do not demonstrate that capital moved between the instruments shown.
The advances in INJ, ICP, ASTER and ZRO establish relative strength over the reported window. The declines in KORUB, SNXXB, SOXLB, INTCB and PUMP establish relative weakness. There is no transaction-level evidence linking those outcomes.
Nor does the snapshot establish a shared sector explanation. Instrument classifications, underlying exposures and news catalysts are absent. Assigning a common investment theme from ticker names would introduce assumptions into an otherwise factual comparison.
This leaves rotation as a question for further evidence. Repeated relative strength, verified instrument classifications and broader participation data could help evaluate that question. The current ranking provides a starting observation, not the missing causal link.
Turnover adds context without revealing conviction
Reported volume helps distinguish the scale of trading activity from the size of a price move. HUMA’s reported volume was $16,638,636. ASTER recorded $17,931,960 despite its smaller percentage advance, while ICP recorded $12,872,238 and INJ recorded $10,210,627. ZRO’s reported volume was $8,182,639.
These comparisons show that the order of percentage gains does not match the order of reported turnover. They do not establish that any move was more informed, more sustainable or more broadly supported.
The same distinction matters on the declining side. SOXLB’s reported volume of $61,953,391 was the largest in the supplied selection, alongside a reported decline of -5.33%. That is substantial activity relative to the other listed instruments, but it is not a measure of money leaving the market.
Turnover is trading activity, not net capital flow. Each completed trade has a buyer and a seller. A reported volume total does not identify which participant initiated a transaction or reveal the purpose behind it.
The snapshot also lacks historical volume comparisons. Without an instrument’s usual activity level, a large absolute figure cannot be called an unusual surge. Different instruments may routinely trade at very different scales.
The drivers remain unresolved
Price changes are visible here; their causes are not. The facts contain no project announcements, economic releases, order-book observations or other verified events that would explain the moves.
That boundary is especially important when an outlier invites a tidy narrative. A strong gain can tempt an analyst to attribute the move to informed buying. A decline with heavy turnover can tempt an analyst to describe forced selling. Neither explanation is supported by this dataset.
Several distinct measurements would be needed to examine such claims. An order book records available buy and sell orders at quoted prices. Trade-level records can help examine how transactions occurred. Verified announcements can establish whether a relevant event happened during the observation window. None is supplied here.
Even an event occurring alongside a price move would require care before assigning causation. The useful analytical conclusion is not that the moves lack drivers. It is that the drivers cannot be identified from these figures alone.
A percentage move does not measure execution risk
A leaderboard ranks realised price changes. It does not rank the ease of entering or exiting an instrument.
Liquidity is the ability to transact without materially affecting the price. Reported volume offers context about past activity, but available liquidity also depends on the orders present when a trade is attempted. Those conditions are not shown in the snapshot.
Slippage is the difference between an expected execution price and the price actually obtained. Neither slippage nor the spread between quoted buying and selling prices can be calculated from the supplied last prices and volume totals.
The observation window introduces another limit. Its percentage change compares endpoints without showing the path between them. A relatively steady advance and a volatile sequence of reversals can produce the same endpoint return. The ranking contains no intraday path with which to distinguish them.
What this means for you
For a trader reading this snapshot, the useful distinction is between what the market recorded and what an analyst might infer. The recorded evidence is clear: HUMA led the supplied gainers, the listed outcomes varied substantially, and SOXLB carried the highest reported volume in this selection despite declining.
The broader interpretation remains conditional. Selective strength is visible; market-wide confidence is unproven. Rotation is possible; linked capital movement is unobserved. Activity is measurable; participant motives are unknown.
This makes the leaderboard useful as a map of relative performance. Its value comes from identifying where the differences are most pronounced while keeping explanations proportionate to the evidence.
- HUMA led the supplied gainers, but the ranking cannot establish broad market strength
- Simultaneous gains and losses do not prove capital rotation between instruments
- Reported turnover measures activity, not net flows, conviction or executable liquidity
Explore Formion at app.formion.ai.
Trade these setups — don't just read about them.
See these signals live in the Formion trading terminal.
- Free to start
- No card required