Formion Gold FRVP: What a 50% Win Rate Actually Tells Us

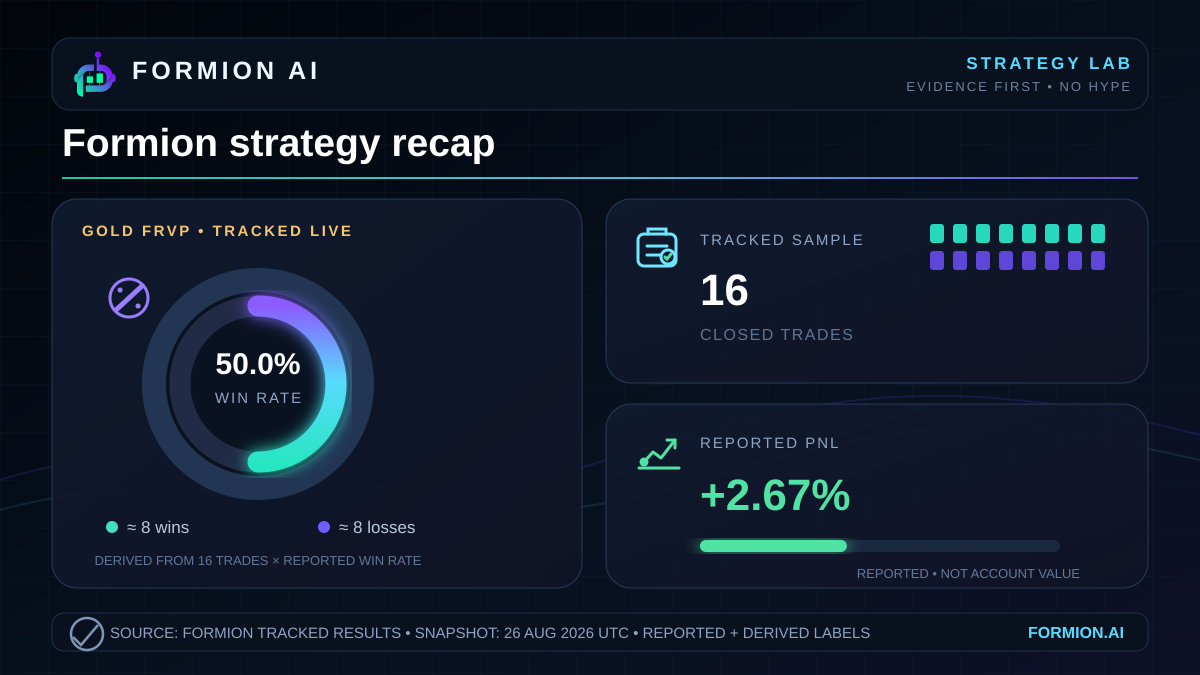
A win rate tells you how often a strategy wins. It does not tell you whether those wins pay for its losses. That distinction matters when reading Formion Gold FRVP’s tracked live results for October 22: 16 trades, a 50% win rate and reported PnL of 2.67%. PnL means profit and loss; here, it is supplied as a percentage.
The combination is useful precisely because it resists a simple success story. Half the trades were classified as wins, yet the reported PnL was positive. That is a result worth examining, but it is not enough to establish a durable trading advantage.
Meanwhile, the supplied market snapshot shows notable positive moves across several assets. Those moves provide context for the recap. They do not explain the strategy’s performance.
Win frequency and reported performance
Winning often and earning money are different questions
Win rate measures the share of trades classified as profitable. It gives every trade equal weight: a small winning trade counts as a win just as a large winning trade does. It therefore leaves out the size of the gains and losses.
To understand why that matters, consider payoff balance: the relationship between what winning trades earn and what losing trades cost. A strategy can win frequently and still lose money if its losing trades are sufficiently costly. It can also win less frequently and remain profitable if its gains outweigh its losses.
The supplied Gold FRVP figures illustrate the distinction without revealing the underlying trade economics. The reported 50% win rate describes frequency. The reported 2.67% PnL describes a positive percentage result. Neither figure supplies the average winning trade, the average losing trade or the amount allocated to each position.
Those omissions matter. Equal numbers of winning and losing trades do not imply equal amounts of money gained and lost.
A worked reading of the Gold FRVP snapshot
Start with the trade count: 16 trades. This tells us how many trades appear in the reported record. It does not tell us how long the strategy took to generate them, whether positions overlapped or whether several trades responded to the same market move.
Next, read the 50% win rate. Half the reported trades were classified as wins. The remaining trades were not classified as wins; the supplied facts do not explain whether the reporting method separates losses from trades that finished without a gain or loss.
Finally, read the 2.67% reported PnL. The reported percentage outcome is positive. We can state that directly, without suggesting every trade performed well or that the strategy won more often than it did not.
The tempting next step is to reconstruct the result: perhaps the winners were larger, perhaps position sizes differed, perhaps another accounting detail mattered. The snapshot does not establish which explanation applies. A worked reading should stop at that boundary instead of turning a plausible mechanism into a claim about actual execution.
There is also a denominator problem. A percentage needs a reference amount—the denominator used to calculate it. That reference amount is not supplied here. Neither is current account value. We therefore cannot translate the reported PnL into a monetary gain or describe it as a return on known starting capital.
This is the central lesson: a result can be clearly positive while its calculation remains only partly documented.
What the market backdrop adds
The selected market movers were strong over their reported 24h windows.  AVA rose 13.96%, quoted at $0.365.
 PROM advanced 13.54%, quoted at $5.836, while
 PHA gained 9.46%, quoted at $0.0625.
That establishes notable appreciation in the named assets. It does not establish market breadth, meaning how widely gains or losses are spread across the overall market. A list of selected positive movers cannot tell us whether most assets rose, whether declines were widespread elsewhere or whether these moves were exceptional.
Nor does it establish a benchmark for Gold FRVP. A benchmark is a reference used to judge performance. A useful comparison requires compatible measurement periods and a relevant relationship between the strategy and the reference assets.
Here, the movers have an explicit 24h window, while the strategy’s reporting window is unspecified. Its traded instruments and exposures are also absent. Comparing the strategy’s reported percentage directly with these asset moves would therefore imply a relationship the facts do not support.
A positive result with limited explanatory power
The weak point in this recap is not that the win rate was 50%. That figure alone is neither proof of strength nor proof of failure. The weakness is how little the available record says about the path to the positive result.
We do not have drawdown—the decline from a previous peak in account or strategy value. We do not have trade-level outcomes, cost treatment or a longer performance history. Without them, the reported gain cannot tell us how uneven the experience was or whether the same pattern has persisted.
Gold FRVP’s tracked live snapshot deserves a precise description: positive reported PnL across a limited trade record, with half the trades classified as wins. The market supplied conspicuous positive movers, but their connection to the strategy remains unknown. These are tracked results, not promises.
- Gold FRVP reported 2.67% PnL across 16 trades with a 50% win rate
- Win frequency does not establish payoff size, risk or repeatability
- Selected market movers provide context, but no matched benchmark
- The PnL denominator, reporting window and current account value are not supplied
Explore Formion at app.formion.ai.
Trade these setups — don't just read about them.
See these signals live in the Formion trading terminal.
- Free to start
- No card required