Crypto Movers: Uneven Risk Appetite, Unproven Rotation

A market can reward risk in some assets while punishing it elsewhere. Dispersion—the difference between individual assets’ returns—helps describe that split. It matters because a strong gainers list can look encouraging even when other assets are experiencing substantial losses.
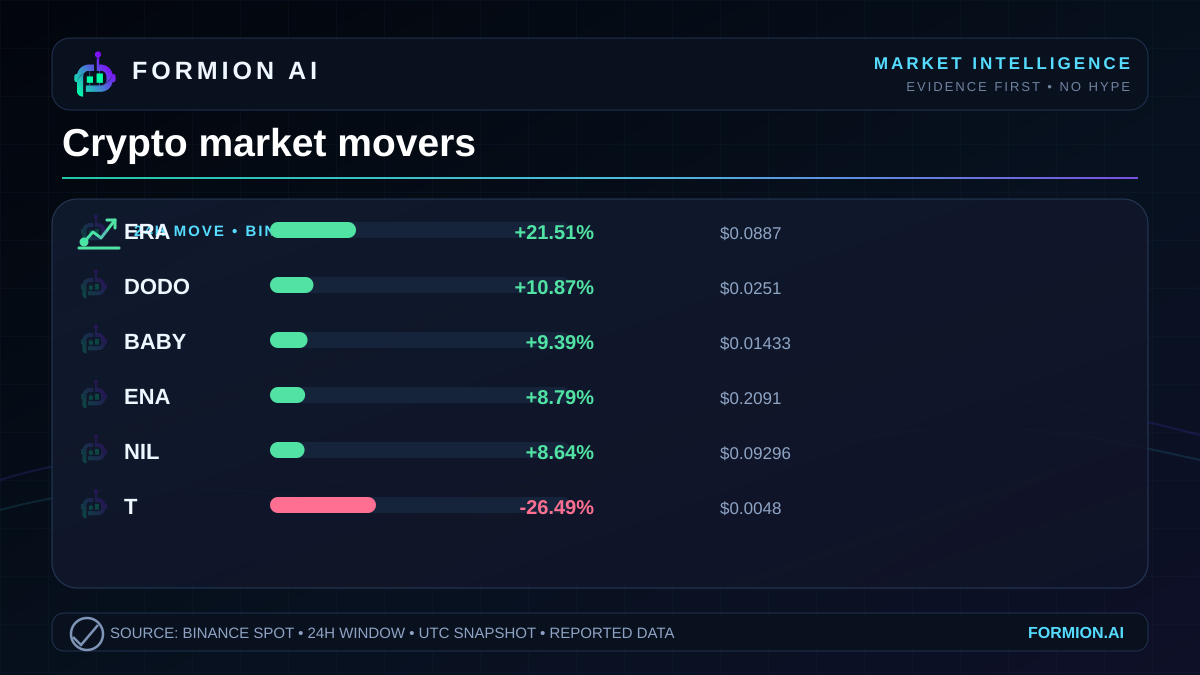
The Binance snapshot for October 26, 2026 shows precisely that tension.  ERA leads the reported gainers with a rise of +21.51%, while
 T leads the losers at -26.49%. Those moves establish a wide separation between the listed extremes. They do not establish whether the broader crypto market is strengthening.
The useful question is therefore narrower than whether traders are becoming bullish: how widely is strength distributed, and what evidence would distinguish isolated repricing from a broader change in risk appetite?
A divided market snapshot
What the leaderboard actually measures
Risk appetite means willingness to accept uncertainty and potential losses in pursuit of returns. Prices can offer clues about it, but a leaderboard measures outcomes rather than motives. An asset’s rise does not reveal who bought it, why they bought it, or how their exposure was financed.
The supplied figures cover Binance markets quoted in  USDT. Each percentage describes the reported price change over the preceding 24h window. The last price is the reported endpoint, not an average execution price or a price necessarily available for a large order.
| Symbol | 24h change | Last price |
|---|---|---|
| ERA | +21.51% | $0.0887 |
 DODO | +10.87% | $0.0251 |
 BABY | +9.39% | $0.01433 |
 ENA | +8.79% | $0.2091 |
 NIL | +8.64% | $0.09296 |
| T | -26.49% | $0.0048 |
 GTC | -9.66% | $0.22761 |
 WLD | -3.21% | $0.4408 |
 SOXLB | -1.85% | $82.43 |
 ZRO | -1.47% | $1.679 |
The pattern is uneven within each side. The leading gainer is substantially ahead of the remaining listed advances. On the losing side, the steepest decline also stands apart from the rest.
That supports a limited conclusion: these selected assets experienced markedly different price outcomes. Calling the whole market either confident or defensive would require evidence beyond its biggest movers.
Dispersion is different from breadth
Market breadth describes how widely a move is shared across a defined market. A rising market with broad participation has many constituents advancing. A market supported by a narrow group can present a very different picture, even if its most visible winners look strong.
This snapshot cannot measure breadth. It provides selected gainers and losers, without the full set of markets or the distribution of their returns. The presence of both groups is a feature of the ranking, not evidence that the market is evenly divided.
Dispersion asks a different question: how far apart are the outcomes? The listed extremes clearly show substantial separation. But even here, precision matters. They illustrate dispersion among selected movers; they do not provide a complete statistical measure of dispersion across Binance.
Why does that distinction matter? Because an asset-specific move can be mistaken for a market-wide signal. A trader observing only the strongest names may perceive widespread enthusiasm. Someone focused on the largest declines may perceive widespread stress. Both are looking at real prices through a selective window.
The disciplined reading preserves what the data establishes while leaving the broader diagnosis open.
A worked example: price movement versus trading activity
Compare ERA with ENA. The former has the larger reported price gain, at +21.51%, alongside reported volume of $15,326,154. The latter advances +8.79%, with reported volume of $35,102,883.
Trading volume measures reported trading activity over the stated window. Here, the asset with the smaller percentage gain has the larger reported dollar volume. Ranking assets by price change therefore produces a different view from ranking them by trading activity.
This is useful context, but it does not make either move more durable. Volume is not a measure of net new money entering an asset: a completed trade has a buyer and a seller. Nor does reported volume establish liquidity, meaning the ability to execute an order without materially moving the price.
Now compare the losing side. WLD records a -3.21% move with reported volume of $31,160,080. T falls -26.49% with reported volume of $7,565,128. The more severe decline occurs alongside lower reported dollar volume in this comparison.
The lesson is not that lower volume caused the larger loss. The snapshot cannot establish that causal relationship. It shows that price-change magnitude and reported trading activity are distinct dimensions. Neither should silently substitute for the other.
Rotation needs a connection, not just opposite signs
Rotation is a shift in capital allocation from one asset or group toward another. Rising and falling assets can be consistent with rotation, but opposing returns alone do not demonstrate that shift.
To establish a stronger rotation argument, an analyst would need additional evidence: a coherent grouping of assets, repeated relative performance over time, and evidence connecting changes in allocation. None of those connections is supplied here. Assigning a sector narrative from the symbols alone would add assumptions to the record.
Relative performance simply means how an asset performs compared with another asset or a defined benchmark. The snapshot supports direct comparisons among the listed names. It does not identify a market benchmark or explain why the differences emerged.
For this session, the defensible interpretation is selective strength alongside concentrated weakness. Some assets registered substantial advances, while the weakest listed asset experienced a larger percentage decline than the strongest listed advance. That is evidence of uneven outcomes, not a verdict on aggregate risk appetite.
The next analytical step is to test whether that separation persists and whether participation extends beyond the leaderboard. Until then, the clearest insight is also the most restrained: the market’s extremes describe where prices moved most, while leaving the reasons and broader participation unresolved.
- The listed movers show uneven price outcomes, not a complete measure of market breadth
- Reported volume measures trading activity, not net inflows or execution liquidity
- Opposing returns can suggest a rotation hypothesis but cannot prove capital moved between assets
Explore Formion at app.formion.ai.
Trade these setups — don't just read about them.
See these signals live in the Formion trading terminal.
- Free to start
- No card required