Crypto movers show sharp divergence, not broad risk appetite
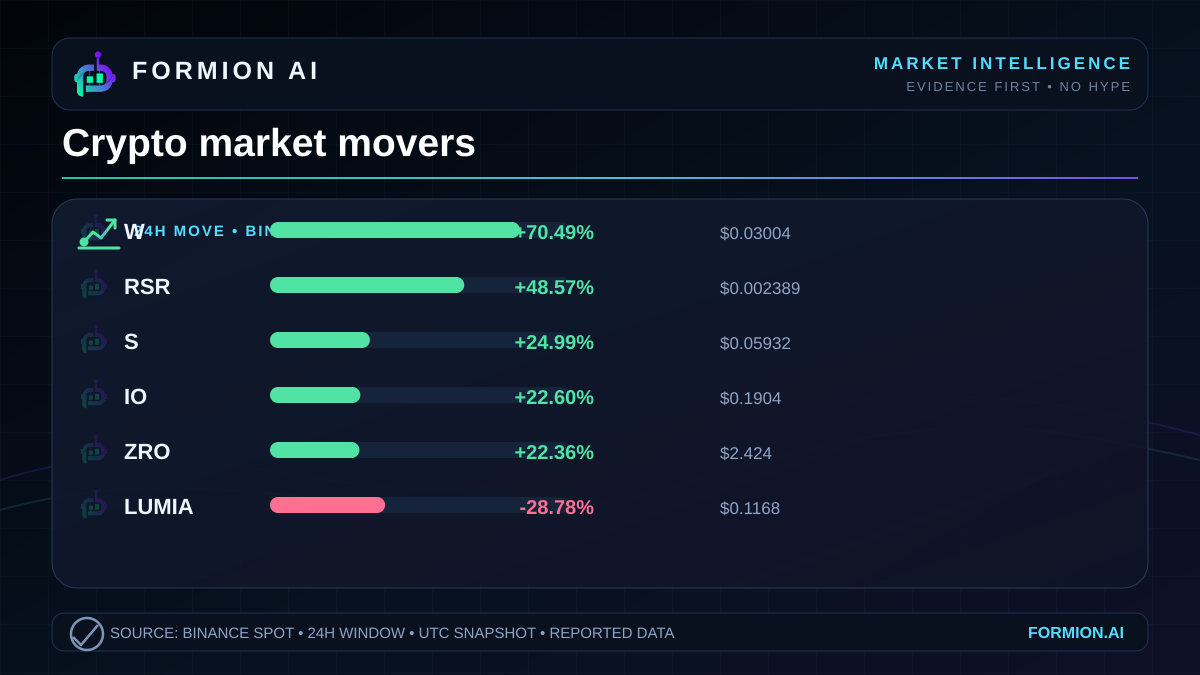
Crypto’s biggest movers on October 12, 2026 showed sharply divergent outcomes:  W gained +70.49%, while
  LUMIA fell -28.78% in the reported Binance
  USDT market snapshot. The scale of those moves makes selective risk appetite a useful lens, but a leaderboard alone cannot establish broad market strength or prove that capital rotated between the assets.
A divided session in crypto
The numbers
These are the supplied top gainers and losers for Binance’s quoted markets. Last prices are snapshot observations, not guaranteed execution prices, and the percentage changes describe the reported window rather than a forecast.
| Symbol | Reported 24h change | Last price |
|---|---|---|
| W | +70.49% | $0.03004 |
 RSR RSR | +48.57% | $0.002389 |
 S S | +24.99% | $0.05932 |
 IO IO | +22.6% | $0.1904 |
 ZRO ZRO | +22.36% | $2.424 |
| LUMIA | -28.78% | $0.1168 |
 ERA ERA | -16.07% | $0.0721 |
 RVN RVN | -14.58% | $0.001716 |
 OGN OGN | -14.21% | $0.03055 |
 CFX CFX | -7.56% | $0.06381 |
The positive side contains substantial advances across every listed asset. The negative side also contains material declines. That contrast is the central observation: the selected extremes show very different outcomes within the same reporting window.
However, this is a list selected for exceptional movement. It does not show how the typical asset performed, how many markets advanced, or whether a broad benchmark rose or fell.
Strong winners do not establish a strong market
Risk appetite describes investors’ willingness to accept uncertainty in pursuit of returns. Large gains are compatible with that willingness, but they are an incomplete measure of it. An asset can appreciate sharply while conditions elsewhere remain weak or mixed.
The reported +48.57% advance in RSR, alongside the leading gain in W, establishes that pronounced appreciation occurred in parts of this snapshot. It does not establish that participants became more comfortable with crypto risk generally.
The missing concept is market breadth: how widely a move is shared across the market. A broad advance and a narrow rally can produce similarly striking leaders. Distinguishing them requires information beyond the strongest and weakest performers.
This matters because rankings naturally direct attention toward exceptional outcomes. Reading those outcomes as representative would turn a deliberately selective sample into a market-wide conclusion. The evidence supports sharp divergence; broader enthusiasm remains unverified.
Rotation is a hypothesis, not an observed transfer
Rotation means a shift in capital allocation between assets or groups of assets. In market commentary, simultaneous winners and losers often become shorthand for that process. Here, that shorthand would go beyond the evidence.
The decline in LUMIA and the gains elsewhere occurred within the same reported window. That is a timing relationship, not proof of a funding relationship. The dataset contains no evidence connecting the participants or transactions behind those moves.
Nor does it establish a shared theme among the winners. Assigning the session to a sector narrative would require information about classifications, relevant developments and comparable assets that is absent from the supplied facts.
Uneven performance is observable; rotation is not directly demonstrated. That distinction does not make the snapshot uninformative. It identifies where repricing was most pronounced while keeping the explanation open. A credible rotation argument would need additional evidence showing a broader, coherent shift rather than merely opposing signs on a leaderboard.
Volume adds context without identifying conviction
Reported volume measures trading activity. It is useful alongside price because it helps distinguish the size of a percentage move from the amount of turnover associated with that market. It does not reveal participants’ motives or establish net capital entering an asset.
Among the listed assets, S had the highest reported volume at $44,306,833, accompanying a +24.99% gain. W recorded $42,567,638 alongside its larger percentage advance. The largest gain therefore did not coincide with the largest reported turnover in this selection.
The losing side provides another useful comparison. CFX declined -7.56% on reported volume of $27,302,739, while LUMIA fell -28.78% on $19,699,299. A deeper percentage decline did not require higher reported volume here.
These comparisons demonstrate why turnover cannot serve as a simple confidence score. Every completed trade has a buyer and a seller. Aggregate volume alone cannot identify accumulation, distribution, leverage or hedging, and it does not count distinct participants.
It also lacks a historical baseline in this dataset. Without normal turnover for each asset, describing the reported activity as unusually high would be unsupported.
Price movement and tradable liquidity are different things
Liquidity is the ability to execute a trade without materially moving the price. Reported turnover provides context, but execution also depends on available orders, their size and the distance between buying and selling quotes.
None of that order-book information appears in the snapshot. Consequently, neither a large gain nor substantial reported volume establishes that a market could absorb a particular order at its displayed last price.
A last price records a transaction; it is not a promise about the next transaction. Slippage is the difference between an expected execution price and the price actually obtained. The table cannot quantify it.
Nominal prices also need careful interpretation. RVN at $0.001716 is not demonstrably cheaper in valuation terms than ZRO at $2.424. A unit price alone says nothing conclusive about total valuation without supply information, and the supplied facts contain no such comparison.
The window shows an outcome, not the path
A reported window change compresses the intervening trading into an endpoint comparison. It cannot show whether an asset advanced steadily, reversed an earlier decline or surrendered part of a larger gain before the snapshot.
That limitation matters when discussing drivers. Similar endpoint returns can emerge from very different trading paths. The data contains no intraday sequence, announcement history or positioning evidence that would justify selecting a particular explanation.
A short squeeze, for example, involves pressure on short positions as prices rise. A sharp gain alone does not establish that mechanism. Likewise, a steep decline cannot by itself establish forced liquidation.
The same discipline applies to persistence. The snapshot records what happened during the supplied window; it cannot determine whether those conditions continued afterward. Interpreting the figures as evidence of an enduring trend would require observations across time that are not available here.
What this means for you
The useful conclusion is specific: this selection shows substantial gains and substantial losses coexisting, with reported turnover distributed differently from percentage performance. It offers evidence of divergent repricing, while leaving the causes and broader market context unresolved.
For a serious market reader, the distinction between observation and explanation is essential. Price change identifies the outcome. Volume adds activity context. Breadth, transaction evidence and execution conditions would answer different questions, none of which can be resolved by reinterpreting the same leaderboard.
The figures warrant attention because they describe large differences in performance. They do not require a single narrative to be useful. Keeping uncertainty explicit preserves the value of the verified observations.
- The reported movers show sharp divergence, while broad risk appetite remains unverified
- Opposing price moves do not prove capital rotated between the listed assets
- Reported volume adds activity context without establishing motives, liquidity or execution quality
Explore Formion at app.formion.ai.
Trade these setups — don't just read about them.
See these signals live in the Formion trading terminal.
- Free to start
- No card required