Formion Gold FRVP: +2.17% PnL in a sharply uneven market

Formion Gold FRVP’s tracked live snapshot for November 14, 2026 reports 10 trades, a 66.7% win rate and +2.17% PnL. Alongside it, the supplied market snapshot shows sharp gains among notable movers, led by  SHELL. The strategy result is positive, but assessing its quality requires separating reported performance from what the available evidence cannot establish.
Gold FRVP: the reported result
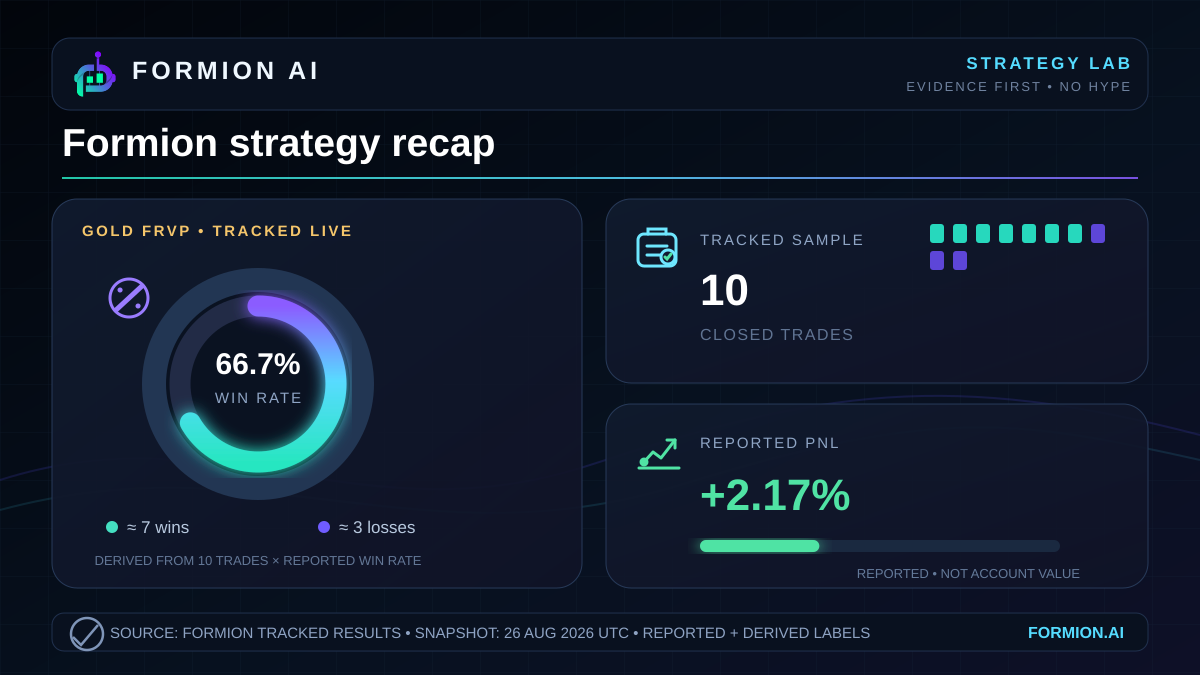
The numbers
The strategy figures describe Formion Gold FRVP’s tracked live record. The market figures describe notable price movers over a stated 24-hour window. They appear together for context, but the supplied facts do not establish that the strategy measurement covers that same window.
| Strategy or market symbol | Reported measure | Reported result | Additional supplied detail |
|---|---|---|---|
| Formion Gold FRVP | PnL | +2.17% | Tracked live |
| Formion Gold FRVP | Win rate | 66.7% | Calculation basis not supplied |
| Formion Gold FRVP | Trades | 10 | Trade-level outcomes not supplied |
| SHELL | 24h price change | +85.55% | Quoted price: $0.03607 |
 DODO | 24h price change | +21.49% | Quoted price: $0.03307 |
 SOXSB | 24h price change | +11.79% | Quoted price: $52.8 |
These are reported figures, not an independently reconstructed performance record. The snapshot supplies no individual executions, account values or cash-flow history from which to reproduce the strategy return.
A positive result with an undefined measurement window
PnL means profit and loss. Here, the reported percentage is positive, so the supplied record presents Gold FRVP as profitable over its measurement period. That is the central finding. It deserves to be stated plainly without turning a limited snapshot into a broader claim about consistency.
The reporting date does not establish when that measurement period began. Consequently, describing +2.17% as the strategy’s daily return would go beyond the evidence. The same limitation prevents a clean comparison with the market movers, whose changes explicitly cover 24 hours.
The percentage also needs a denominator: the capital base against which profit or loss was measured. That base is not supplied. Neither is current account value. Even if current account value were available, it would not automatically establish the correct denominator for a return measured over an earlier window.
The distinction matters because a percentage alone cannot tell readers the absolute amount earned or the amount of capital exposed. Nor does this snapshot specify whether the PnL includes open positions, closed positions, trading costs or some combination. The positive figure remains useful; its accounting scope remains unresolved.
The win rate needs a clearer denominator
Win rate generally describes the share of eligible outcomes classified as wins. It measures frequency, not the size of those wins or losses. A strategy can win frequently and still lose money if its losing outcomes outweigh its gains. Conversely, profitability does not require every trade to succeed.
Gold FRVP reports a 66.7% win rate, but the accompanying count of 10 trades does not provide a straightforward reconciliation. A simple calculation using whole winning trades divided by all 10 reported trades would not produce that percentage.
That is a reporting ambiguity, not evidence that a particular explanation is correct. Different eligibility rules or reporting scopes could produce different denominators, but none is documented here. It would therefore be inappropriate to assign a precise winning-trade count or claim that some trades remain open.
The disciplined reading preserves both reported figures while keeping their relationship unresolved. Until the calculation basis is available, 66.7% should be presented as the reported win rate, rather than as a fully verified description of the 10-trade set.
Strong movers provide context, not attribution
The supplied market list shows substantial positive price changes. It does not show the entire market, and it does not identify which assets Gold FRVP traded. Those boundaries are essential when connecting a strategy recap to the day’s trading environment.
A list of notable gainers is selective by construction. It can demonstrate that pronounced upward moves occurred in the named assets, but it cannot establish broad market strength, the participation of other assets or the conditions throughout the strategy’s reporting window.
There is also no supplied evidence explaining what drove these moves. No news catalyst, volume data, order-book information or positioning record accompanies the prices. Attributing the gains to new demand, liquidations or a specific announcement would introduce a narrative unsupported by the facts.
Likewise, the strategy’s positive PnL cannot be attributed to participation in these rallies. Its holdings, trade direction, entry points and exits are absent. The market figures help describe the backdrop; they do not explain the source of the strategy’s profit.
This is where a measured recap should resist the temptation to make a complete story from adjacent numbers. Simultaneous presentation is not proof of a trading connection.
Why the largest rally is not a performance benchmark
A market price change and a strategy return answer different questions. The former describes how an asset’s quoted price changed over a specified interval. The latter describes a reported trading outcome relative to a capital base and accounting method.
Comparing them meaningfully requires aligned measurement windows and a defined benchmark. A benchmark is a reference against which performance is evaluated. Selecting a conspicuous gainer after its move does not establish that it was an appropriate reference for the strategy beforehand.
The supplied facts provide no mandate requiring Gold FRVP to hold the listed movers or capture their gains. They also provide no exposure data. There is therefore no basis for declaring that the strategy underperformed simply because its reported percentage is smaller than the listed asset changes.
The reverse claim would be equally unsupported. A smaller positive return does not demonstrate superior risk control, disciplined execution or efficient capital use. Those conclusions require evidence about the positions taken and the losses experienced along the way.
The useful comparison here is descriptive: positive tracked strategy PnL appeared alongside notable asset rallies. A ranking of trading quality would require considerably more information.
What the snapshot leaves unmeasured
The main weakness of this record is its limited explanatory depth. The supplied trade count provides a narrow evidence base, and there is no sequence of outcomes showing whether profits were spread across trades or concentrated in a particular result.
Drawdown—the decline from a prior peak in account or strategy value—is also absent. A positive ending PnL does not reveal how far performance fell before reaching that point. Without that path, readers cannot assess the severity of interim losses.
Average winning and losing outcomes would help connect the win rate to profitability. Cost treatment would clarify how closely the reported result corresponds to a net trading outcome. A defined reporting window would make comparisons less ambiguous.
These omissions do not negate the positive result. They limit the conclusions that can responsibly be drawn from it. The next useful improvement is a more transparent measurement record, rather than stronger language about performance.
What this means for you
Read this update as a bounded account of tracked results. Gold FRVP reports positive PnL and a win rate above half, while the supplied market context contains substantial gainers. Neither observation establishes how the next trading period will unfold.
For evaluating the record, the practical questions concern measurement: which outcomes enter the win-rate calculation, what period the PnL covers, and what capital base supports the percentage. Clear answers would make the figures easier to reproduce and compare.
For now, the defensible conclusion is modest but concrete: the reported result is positive, while its risk profile and calculation details remain insufficiently documented in this snapshot. Tracked results are evidence about a reported past outcome, not promises.
- Gold FRVP reports +2.17% PnL, a 66.7% win rate and 10 trades
- The win-rate denominator and strategy measurement window remain unspecified
- Notable market rallies provide context without proving strategy exposure or repeatability
Explore Formion at app.formion.ai.
Trade these setups — don't just read about them.
See these signals live in the Formion trading terminal.
- Free to start
- No card required