Crypto Movers Show Uneven Risk Appetite, Not Broad Rotation
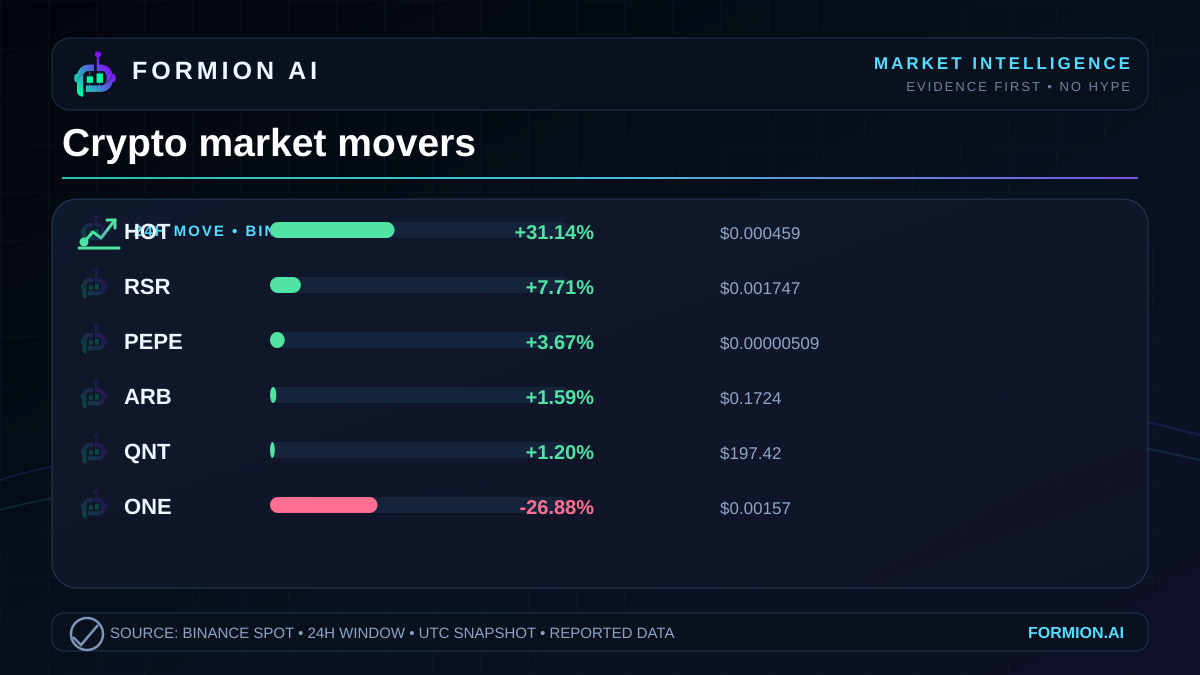
The reported Binance market snapshot for November 9, 2026 shows a sharply divided session:  HOT gained 31.14%, while
 ONE fell 26.88%. That divergence makes selective risk-taking a more defensible reading than a broad return of confidence, although a leaderboard alone cannot establish where capital came from or where it went.
A divided market at the extremes
The central distinction is between a market containing strong winners and a market showing broad strength. This snapshot establishes the former. Establishing the latter would require evidence beyond the strongest and weakest names, including how the wider market performed and whether participation expanded.
The numbers
The following figures are reported for Binance markets quoted in  USDT. Percentage changes cover the supplied daily window; last prices are snapshot observations, not executable quotes guaranteed to remain available.
| Symbol | 24h change | Last price |
|---|---|---|
| HOT | +31.14% | $0.000459 |
 RSR | +7.71% | $0.001747 |
 PEPE | +3.67% | $0.00000509 |
 ARB | +1.59% | $0.1724 |
 QNT | +1.2% | $197.42 |
| ONE | -26.88% | $0.00157 |
 KORUB | -9.08% | $6.41 |
 BMT | -8.87% | $0.02364 |
 XPL | -8.21% | $0.05131 |
 ZRO | -7.54% | $1.484 |
These are selected extremes, not a representative market index. Their composition is useful for identifying where price changes were concentrated, but it cannot establish the return of the overall market or the experience of a typical participant.
A standout winner does not establish broad confidence
The positive side is led decisively by HOT. Its reported gain is substantially larger than the advance in RSR, while PEPE, ARB and QNT posted more restrained increases.
That shape matters. A headline built around the strongest performer could make the session sound uniformly buoyant, even though the remaining supplied gainers show a different scale of movement. The evidence supports an exceptional move in the leader; it does not show similarly exceptional strength throughout the selection.
Risk appetite means willingness to accept uncertainty in pursuit of returns. Price gains can be consistent with stronger risk appetite, but prices alone do not identify the buyers, their motivations or their portfolio exposure.
Here, the careful interpretation is that strength was unevenly distributed across the supplied names. Whether that reflects temporary interest, a lasting reassessment or an asset-specific development remains unresolved. No catalyst information accompanies the figures, so attributing the move to an announcement or a particular participant group would go beyond the evidence.
The losing side complicates the recovery narrative
The decline in ONE is the clearest negative outlier. Yet the weakness is not confined to that name: KORUB, BMT, XPL and ZRO all recorded substantial reported declines.
Each of those losses is larger in absolute percentage terms than the gains in PEPE, ARB and QNT. That comparison describes this selection, not the market as a whole, but it prevents the strongest winner from dominating the interpretation.
Dispersion is the extent to which asset returns differ from each other. The snapshot shows considerable dispersion at its extremes: pronounced gains coexist with pronounced losses. In practical terms, a general statement that “crypto rose” or “crypto fell” would discard much of the information here.
It would also be premature to describe the losses as capitulation. That term implies an abandonment of positions under pressure, which requires more evidence than a negative daily return. The supplied figures establish the price changes, not the circumstances or intentions behind them.
Volume adds context without revealing conviction
The largest reported volume in the supplied selection belongs to PEPE, at $65,687,186, alongside a 3.67% gain. By comparison, HOT recorded $11,821,390 in reported volume despite its much larger percentage advance.
That is a useful separation: the strongest price move and the largest reported trading activity belong to different assets. A price leaderboard and a volume leaderboard answer different questions.
Reported volume measures trading activity over the relevant window. It is not a measure of net new money entering an asset. Transactions involve buyers and sellers, and the same capital can participate in repeated trades. Volume therefore cannot establish deposits, withdrawals or the amount of capital newly committed.
Nor does high volume automatically mean deep liquidity. Liquidity describes the ability to transact without materially moving the price. Assessing it requires information such as order-book depth and the spread between available buying and selling prices, neither of which is supplied.
On the negative side, ONE recorded $17,274,332 in reported volume. This documents activity alongside its decline, but does not identify forced selling, leverage or liquidation events. Without a historical volume baseline, it is also impossible to determine whether any listed asset’s activity was unusually elevated.
Rotation is a hypothesis, not an observed money trail
Rotation describes a shift in market exposure or attention between assets or groups. A session containing rising and falling names naturally invites that explanation. The difficulty is that simultaneous price changes do not reveal a direct connection between them.
The supplied figures do not show whether participants reducing exposure to ONE bought HOT, held cash or made any other transaction. They also do not provide sector-wide performance, comparable activity across venues or a sequence of observations showing leadership changing over time.
Those omissions matter because a rotation narrative makes a stronger claim than a divergence narrative. Divergence says that returns differed. Rotation proposes a relationship between those differences.
The defensible conclusion is therefore narrower: this snapshot is consistent with selective interest and uneven risk appetite, but it does not prove a coordinated shift between assets. Independent asset-specific developments could also produce this pattern. The available evidence does not distinguish those explanations.
The daily window conceals the route prices took
A daily percentage change compares endpoints. It does not describe the path between them.
The same reported gain could result from a relatively steady advance, an abrupt repricing or a partial recovery after an earlier decline. Those paths carry different information about market behaviour, yet the supplied snapshot cannot separate them.
Last price has similar limits. QNT at $197.42 is not inherently more expensive in valuation terms than HOT at $0.000459. Unit prices do not account for token supply, and the supplied facts contain no supply or valuation figures.
The table is consequently useful as a record of reported relative performance, rather than a complete account of market conditions. It identifies where further explanation is needed without supplying that explanation itself.
What this means for you
The useful reading of this session is disciplined rather than dramatic. There was a standout positive move, a severe negative outlier and meaningful weakness elsewhere in the supplied loser list. The most actively traded asset in the selection was not the strongest percentage gainer.
Together, those observations describe a divided market snapshot. They do not establish a market-wide recovery, a confirmed rotation or a catalyst for any individual asset.
For readers evaluating market commentary, the distinction is straightforward: reported outcomes should remain separate from explanations that still need evidence. That keeps an informative leaderboard from becoming an unsupported story about who traded, why they traded or what happens next.
- Reported gains and losses show sharp divergence across the supplied names
- The largest price gain and highest reported volume belong to different assets
- Rotation remains a hypothesis because the snapshot contains no evidence tracing capital between assets
Explore Formion at app.formion.ai.
Trade these setups — don't just read about them.
See these signals live in the Formion trading terminal.
- Free to start
- No card required