Crypto Movers: Strong Gains, Uneven Risk Appetite

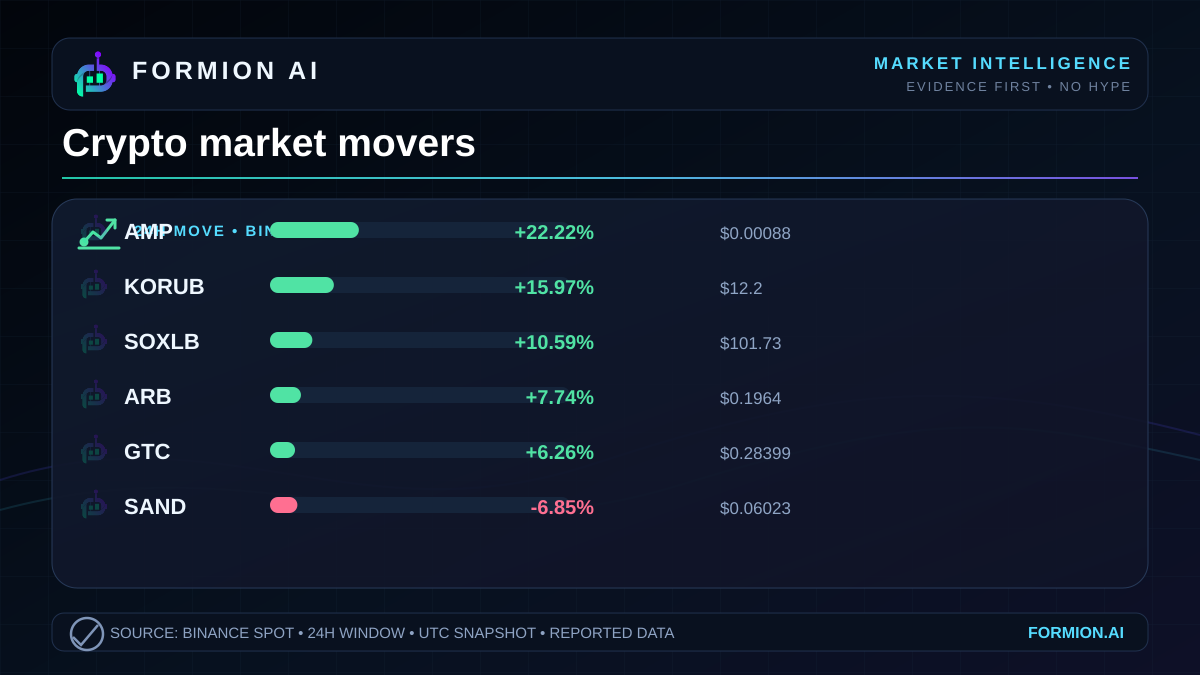
The strongest gains in the October 19, 2026 snapshot are substantially larger than the steepest losses. That gives the leaderboard a positive tilt, but it does not establish a broadly rising market.  AMP leads the reported gainers with a +22.22% move, while
 SAND sits at the bottom of the supplied list at -6.85%. Between those extremes, the picture is selective: sharp advances coexist with meaningful declines.
The useful question is what that contrast reveals about participation. These Binance  USDT market figures show where prices moved and how much volume the venue reported. They do not show whether capital moved directly between the listed instruments, or whether the wider market shared their performance.
A divided market leaderboard
Strong upside leaders, limited evidence of breadth
The gainers have a clear ordering. Behind AMP,  KORUB advances +15.97% and
 SOXLB gains +10.59%.
 ARB and
 GTC follow with +7.74% and +6.26%, respectively. The supplied leaders therefore show substantial positive price movement, although the strength varies considerably across the list.
The losing side remains relevant to any reading of risk appetite. Alongside SAND,  AVA falls -5.76%,
 STRK declines -4.26%,
 AERO loses -4.01%, and
 ERA drops -3.12%. Those declines prevent a simple description of the snapshot as uniformly positive.
| Symbol | 24h change | Last price |
|---|---|---|
| AMP | +22.22% | $0.00088 |
| KORUB | +15.97% | $12.2 |
| SOXLB | +10.59% | $101.73 |
| ARB | +7.74% | $0.1964 |
| GTC | +6.26% | $0.28399 |
| SAND | -6.85% | $0.06023 |
| AVA | -5.76% | $0.3696 |
| STRK | -4.26% | $0.05997 |
| AERO | -4.01% | $0.8044 |
| ERA | -3.12% | $0.0715 |
These are reported last prices and changes for the supplied window. The table captures relative performance within a selected set of extremes. It does not provide market breadth, a benchmark return or the performance of instruments outside the list. Larger gains than losses among these names are an observable feature; a market-wide improvement in risk appetite remains unestablished.
Volume changes the emphasis
Ranking by reported volume produces a different leader from ranking by price change. SOXLB has the highest supplied volume at $34,031,511, accompanying its +10.59% advance. AMP, despite recording the largest percentage gain, has reported volume of $7,779,541.
That distinction matters because the largest price move and the largest volume figure describe different things. A percentage change measures price performance over the window. Reported volume describes trading activity. Neither measure, alone or together, identifies who traded, why they traded or whether the move will persist.
Among the other gainers, KORUB records $15,187,922 in reported volume, GTC records $12,292,326, and ARB records $11,967,972. The price ranking should therefore not be read as a matching ranking of trading activity.
Activity also accompanies falling prices. STRK reports $13,314,861 in volume and AVA reports $12,841,210, both above the figure reported for AMP. SAND records $11,325,101, while ERA records $10,121,320 and AERO records $5,238,282.
These comparisons add context without establishing buy-side or sell-side intent. Reported volume is not evidence of net inflows, withdrawals, leverage or position direction. It also does not supply order-book depth or execution costs. The defensible observation is narrower: substantial reported activity appears on both sides of the performance table.
Rotation is a hypothesis, not a recorded flow
The mixed leaderboard is consistent with selective risk appetite. Some instruments registered sharp advances while others lost ground during the same reported window. That is useful evidence of price dispersion, but dispersion alone cannot establish a rotation of capital.
A rotation claim would require evidence connecting the moves. The supplied snapshot contains no transaction-level flows, participant information or sequence showing that exposure left the declining instruments and entered the advancing ones. It also provides no verified catalysts or instrument classifications from which to construct a sector narrative. Assigning a common theme to the winners would go beyond the evidence.
The strongest conclusion is therefore about uneven performance. Upside leadership is pronounced, and reported trading activity is not confined to the gainers. That combination makes the snapshot more informative than a single headline about the largest advance, while leaving the broader market regime unresolved.
For a serious reading of the day, the distinction between observation and explanation is essential. The price changes are reported observations. Selective risk appetite is a cautious interpretation. Direct capital rotation, common positioning and the durability of these moves remain unanswered questions.
- The largest listed gains exceed the largest listed losses, but market breadth is unknown
- The strongest percentage gainer does not have the highest reported volume
- Mixed performance suggests selective risk appetite without proving capital rotation
Explore Formion at app.formion.ai.
Trade these setups — don't just read about them.
See these signals live in the Formion trading terminal.
- Free to start
- No card required