Crypto movers: selective risk appetite, uneven participation
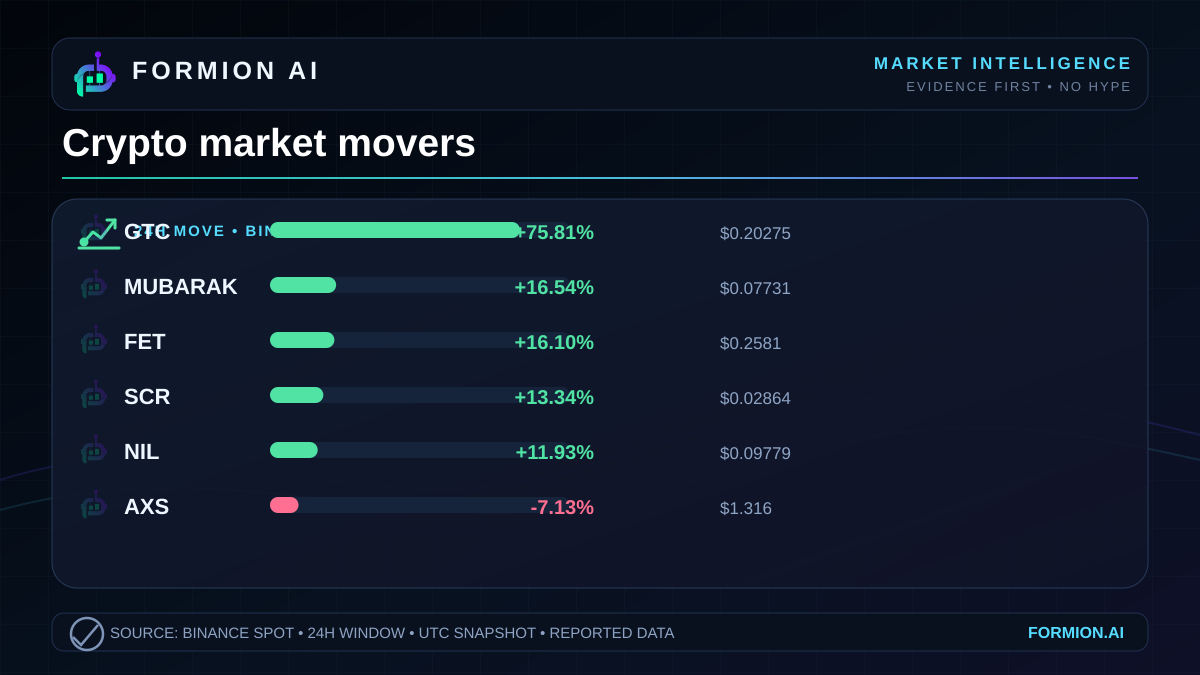
The strongest signal in today’s crypto movers is dispersion.  GTC leads Binance’s reported gainers with a +75.81% move, well ahead of the rest of the list, while losses remain visible elsewhere. That combination is consistent with selective risk appetite. It is insufficient evidence for a market-wide shift.
The distinction matters: a leaderboard captures the extremes. It does not tell us how the typical asset traded, how durable the moves were, or whether money leaving one name financed gains in another.
Daily leaders and laggards
A strong leader, with company
The snapshot below covers the supplied Binance  USDT pairs. Changes, last prices and volumes are venue-reported figures.
| Symbol | 24h change | Last price |
|---|---|---|
| GTC | +75.81% | $0.20275 |
 MUBARAK MUBARAK | +16.54% | $0.07731 |
 FET FET | +16.1% | $0.2581 |
 SCR SCR | +13.34% | $0.02864 |
 NIL NIL | +11.93% | $0.09779 |
 AXS AXS | -7.13% | $1.316 |
 NIGHT NIGHT | -5.56% | $0.04617 |
 ZRO ZRO | -5.1% | $1.917 |
 SAND SAND | -4.5% | $0.07308 |
 QNT QNT | -3.3% | $255.56 |
The upside is not confined to the leading name. MUBARAK and FET post substantial gains, followed by SCR and NIL. Still, the distance between the leader and its peers makes the headline move a poor shorthand for the broader session.
There is also a clear asymmetry within this selected list: the reported gains are larger than the reported declines. That describes the extremes supplied here. Without the full market distribution, it cannot establish positive breadth, a rising aggregate market value or widespread participation.
Volume complicates the headline
The largest percentage gain does not come with the largest reported volume. GTC records $26,724,324, while FET records $47,613,147. MUBARAK, at $26,199,685, has reported volume close to the leader’s despite a much smaller percentage move.
The losing side provides another useful check. QNT reports $48,585,073 in volume alongside its decline, exceeding every supplied gainer’s volume. SAND reports $23,267,587 while also falling. Activity is present on both sides of the performance table.
Those figures describe turnover, not net capital flows. They do not identify buyer conviction, seller motives, leverage or the identity of participants. Nor does the snapshot include order-book depth or historical volume comparisons. Calling any move unusually liquid, institutionally driven or supported by fresh capital would go beyond the evidence.
Rotation remains an interpretation
The simultaneous gains and losses give the session the appearance of rotation: some names advance sharply while others retreat. But actual capital migration is not demonstrated by opposing price changes alone. These could be separate moves with separate causes.
The supplied facts contain no catalysts or sector attribution. Assigning the winners to a dominant narrative, or explaining the losers as the source of funding for that narrative, would turn a plausible story into an unsupported claim.
The useful read is narrower and stronger: this snapshot shows pronounced upside in selected assets alongside continued weakness elsewhere, with substantial reported turnover on both sides. It supports a description of selective risk appetite. It leaves broad participation, the causes of the moves and any direct rotation between assets unresolved.
Explore Formion at app.formion.ai.
Trade these setups — don't just read about them.
See these signals live in the Formion trading terminal.
- Free to start
- No card required