When Perp Leaderboard ROI Breaks: The Denominator Problem

There is a number on this week's Hyperliquid leaderboard that looks like a typo: an ROI of 36,400,455.8%. That is the value reported by the public leaderboard payload. Without a documented denominator for this row, however, the percentage cannot be interpreted as a clean measure of trading performance. It is a useful lesson in what ROI does — and does not — tell you.
PnL tells you the score. ROI tells you the bet.
Two definitions, plainly. PnL (profit and loss) is the dollar result reported for a window — here, seven days. ROI (return on investment) generally compares that result with a capital base defined by the venue. PnL describes the outcome; ROI adds context only when that capital base is known and stable.
The distinction matters because dollars alone do not describe the capital context. The same dollar result on a large stable base and a much smaller stable base would produce very different percentage outcomes. Even then, neither figure alone reveals leverage, concentration, drawdown or whether the book was directional or hedged.
That's why the ROI column is worth inspecting alongside PnL — and why its failure mode matters.
Read a leaderboard ratio in three steps
The denominator problem, live on the board
Look at the top account. Its reported 7-day PnL is $36,400,456. Its current account value is $36,390,458 — slightly less than the reported week's profit — while the API reports ROI of 36,400,455.8%. Under the simple formula ROI = PnL / capital base, those PnL and ROI figures imply a denominator of roughly $100. Current account value clearly is not the denominator used by that percentage.
Why an ROI can explode
Derived from the reported PnL and ROI values in the public payload
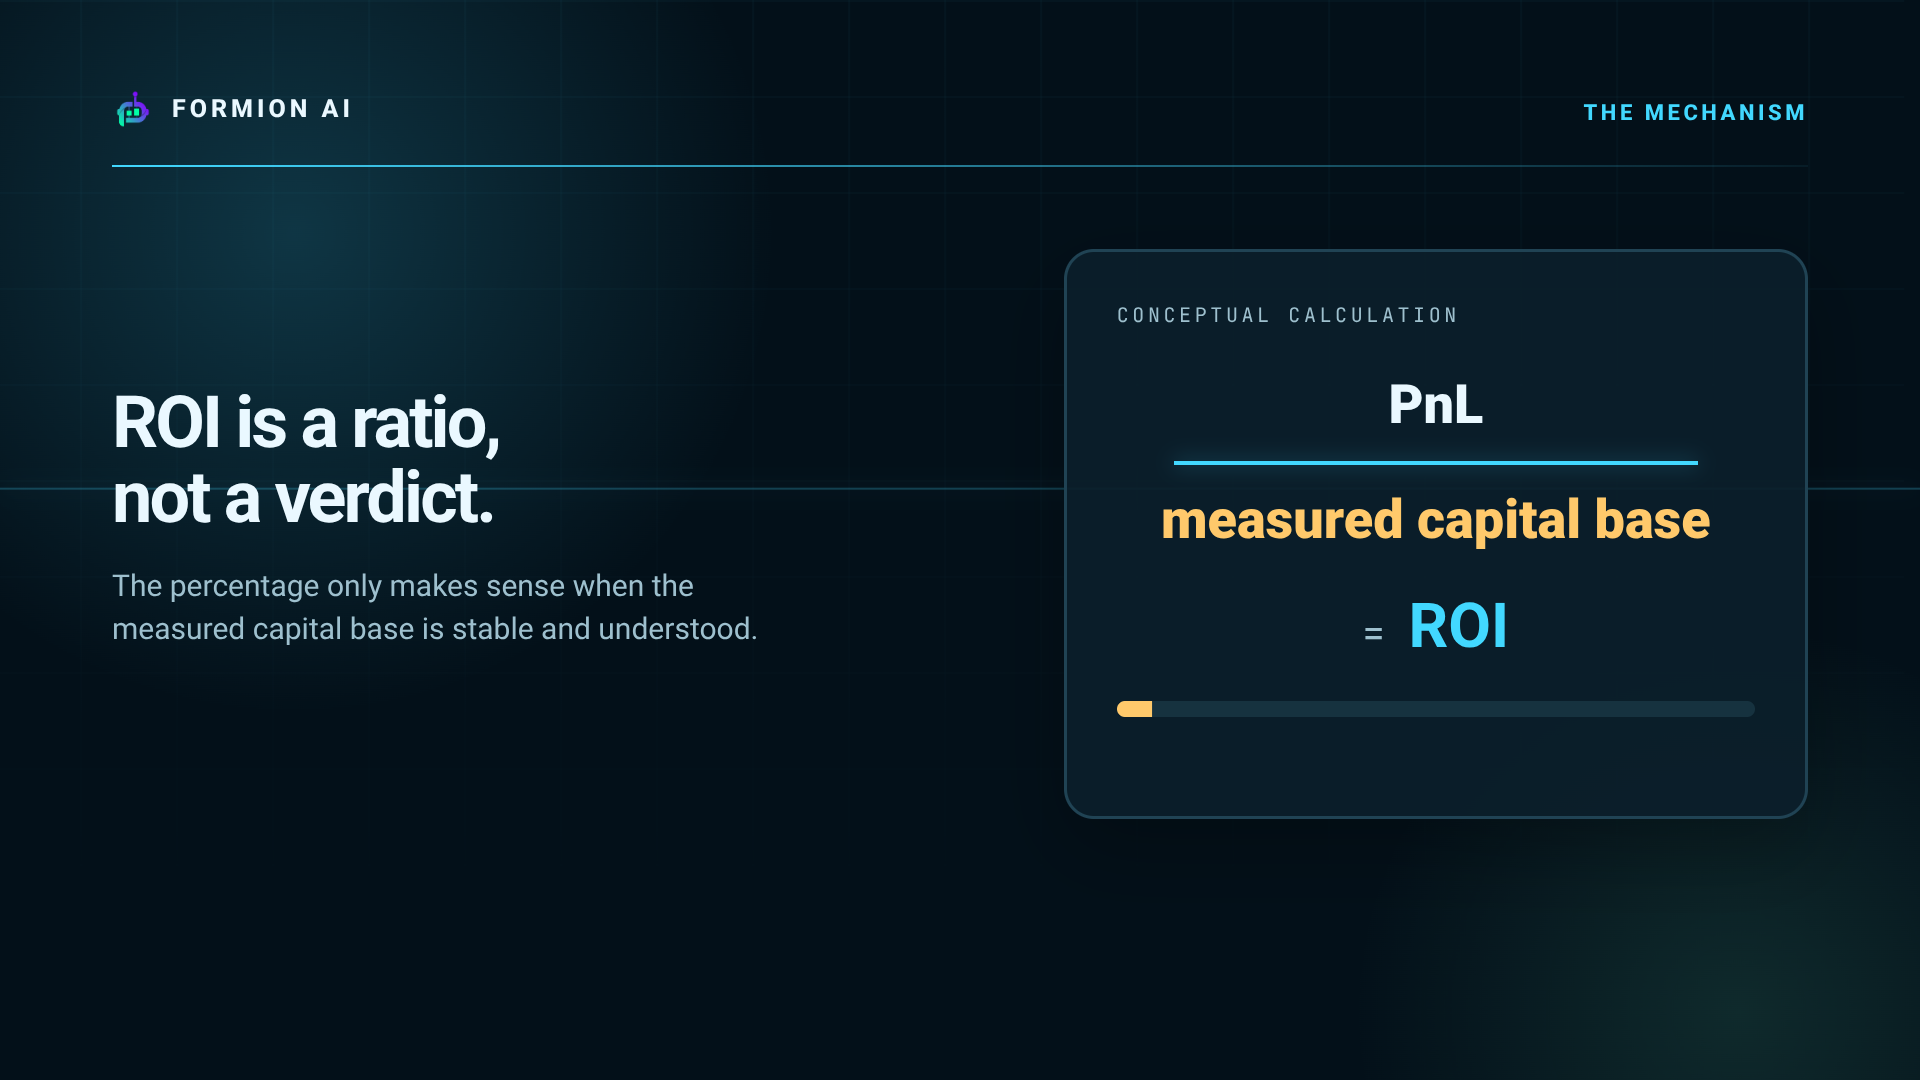
This is the denominator problem: ROI is only as meaningful as the capital base and methodology behind it. A fresh account, transfers during the window, or the venue's own treatment of capital can produce a tiny or unstable denominator. Those are possible explanations, not facts established by this leaderboard row. Without account-flow history and the venue's exact calculation for the window, the outlier should be treated as uninterpretable rather than as evidence of exceptional skill or a specific funding event.
The other rows also show that reported ROI does not equal PnL divided by current account value. That is not automatically an error: current value is a point-in-time figure, while a windowed return may use a starting value, time-weighted capital or another venue-specific base. The public payload provides the outputs, not enough methodology to reconstruct every row. The reading skill remains the same: identify the denominator before interpreting the ratio.
Here is the full top six as of August 3:
| Trader | 7d PnL | ROI | Current account value |
|---|---|---|---|
| 0x2ee6…4d1c | $36,400,456 | 36,400,455.8% | $36,390,458 |
| 0xb83d…6e36 | $18,452,612 | 28.0% | $111,587,750 |
| 0xf822…e01a | $10,526,644 | 18.3% | $58,600,913 |
| 0x5b5d…c060 | $8,812,758 | 28.1% | $55,524,195 |
| 0x856c…910d | $5,659,802 | 12.7% | $73,638,268 |
| 0x0ddf…a902 | $5,650,822 | 89.6% | $19,097,602 |
Reading the other five rows
Set the outlier aside and a coherent picture emerges.
Rows two through five have current account values between $55 million and $111 million, with reported weekly ROI between 12.7% and 28.1%. Those are large outcomes, but the leaderboard alone cannot tell us whether they came from directional exposure, market making, hedged books, leverage or changes in capital during the window. The largest current account on the board, 0xb83d…6e36, reports $18.5 million PnL and 28.0% ROI. That is enough to describe the row, not enough to reconstruct the strategy or its risk path.
The last row is the useful comparison. 0x0ddf…a902 reports $5,650,822 — nearly the same dollar result as 0x856c…910d one row up — alongside a much smaller current account value, $19.1 million versus $73.6 million, and a much higher reported ROI, 89.6% versus 12.7%. The rows clearly have different capital contexts. They do not, by themselves, prove that one account took several times the risk of the other; that would require positions, leverage, drawdown and capital-flow data.
That contrast is the worked example worth internalizing. If you ranked these six by PnL, 0x0ddf…a902 finishes last. Ranked by the reported ROI after excluding the extreme outlier, it finishes first. Neither ranking is universally "correct": PnL orders dollar outcomes, while ROI attempts to normalize those outcomes by a capital base. Only when that base is understood can ROI support a fair comparison.
What the leaderboard cannot establish
The shape of this week's board shows that several accounts with high-eight-figure or nine-figure current values appear among the top reported seven-day PnL rows. It does not establish that those accounts were directionally positioned, unhedged, or exposed throughout the whole window. Answering those questions requires position history, leverage, drawdown and transfer data that the leaderboard table does not provide.
The board also omits the losing side of the distribution and every path taken before the final ranking. It is a selected view of top outcomes, not a complete sample of trader performance or risk.
What does the extreme leaderboard row prove by itself?
- PnL reports the dollar outcome; ROI adds context only when its capital base is known
- The 36,400,455.8% outlier implies a tiny denominator under the simple ROI formula, but the row does not prove why that denominator occurred
- Current account value is not the same thing as the denominator used for a windowed ROI calculation
- Similar PnL beside different current account values and ROI figures deserves investigation, not an automatic risk conclusion
- Leaderboards rank selected outcomes; they do not reveal complete strategy, leverage, drawdown or capital-flow history
Source: Hyperliquid public leaderboard payload, accessed August 3, 2026. Values can change after publication.
See live leaderboards, funding and positioning data in one place at app.formion.ai.
Trade these setups — don't just read about them.
See these signals live in the Formion trading terminal.
- Free to start
- No card required