How to Read a Liquidation Heatmap (Without Fooling Yourself)

Most traders meet the liquidation heatmap the same way: someone posts a screenshot with a glowing band above price, captions it "magnet", and the chart does exactly that an hour later. It looks like a crystal ball.
It isn't. A liquidation heatmap is a model of where leverage may be stacked — useful, but built on assumptions that matter enormously once you start trading from it. This guide covers what the picture shows, why traders monitor dense bands, and the three mistakes that turn a useful context tool into a false forecast.
What the map is actually showing
When a leveraged position falls below a venue's maintenance-margin requirement, the venue's liquidation process takes over. That process is exchange-specific: it may attempt full or partial market execution, transfer a position to a backstop liquidator, or use another mechanism. The resulting flow can still be price-insensitive, but it is not correct to model every estimated liquidation as one guaranteed market order.
A liquidation heatmap estimates where those forced orders sit. It takes open interest, typical leverage tiers, and entry distribution, then projects the price levels at which clusters of positions would be wiped out.
Anatomy of a liquidation heatmap
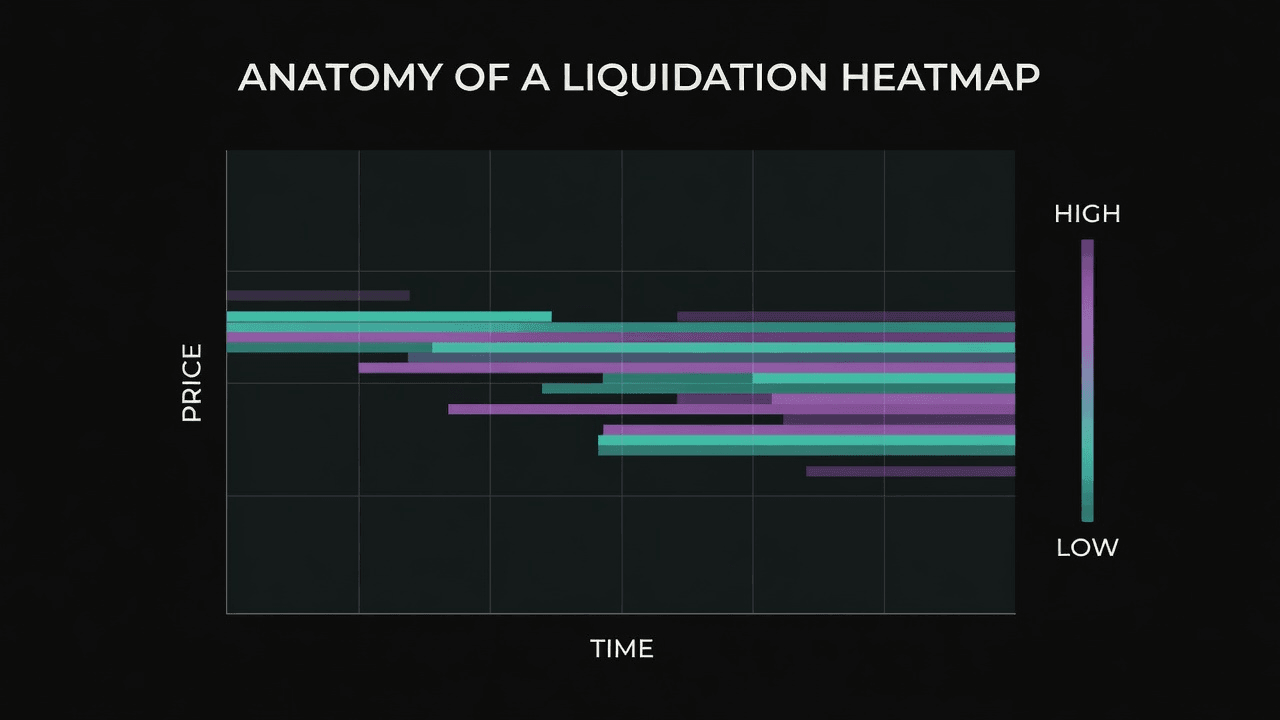
Three things to internalise about that image:
The vertical axis is price, not volume. A band sitting high on the chart is a price level, and its brightness says how much would be force-closed if price got there.
Brightness is magnitude, not probability. This is the single most common misread. A blindingly bright band 12% above spot is not "likely" — it is consequential. Those are different claims.
Bands should update. If price trades through a modelled cluster and the estimated positions are reduced, that cluster should weaken or disappear when the provider recomputes the map. A static screenshot cannot show whether new leverage replaced the old positions.
Every marketwide heatmap depends on modelled leverage and entry distribution. A venue may show a trader an estimated liquidation price for that trader's own position, but it does not publish a complete map of every account's liquidation level. Providers infer that distribution, so two vendors can draw different maps from the same market. Treat any single map as one estimate, not ground truth.
Why bright bands matter without being magnets
The "magnet" language is memorable but too strong. A bright band tells you that a move into that zone could trigger meaningful forced activity under the provider's model. It does not tell you that price is likely to travel there.
If  BTC reaches a dense estimated long-liquidation band, forced reductions may add sell-side flow and amplify an existing move. The size, timing and execution path depend on the venue, available book liquidity, mark-price rules and whether positions are liquidated partially or through a backstop mechanism.
This is why the zone matters as a conditional liquidity map, not why price must move toward it. A heatmap alone cannot establish that any participant is deliberately pushing price toward a cluster.
That third stage is the part most people skip. Once positions represented by a cluster are reduced or closed, the old estimate should no longer be treated as active. A rejection can follow, but so can continuation if new positions, spot flow or broader momentum replace the cleared leverage.
Reading it in practice
The heatmap is context, not a signal. It answers "where is the fuel?" — never "should I buy?". Three ways it earns its place:
Reviewing stops. A stop sitting near an estimated cluster deserves a second look, but the map should not dictate placement by itself. Position size, invalidation, volatility and maximum loss remain the primary constraints.
Judging a breakout. A move into thin estimated liquidation space differs from a move into a dense band, but neither predicts the outcome. Watch execution, spot volume and open interest to see whether the move is being accepted or rejected.
Framing a scenario. A wick through a major cluster followed by a close back inside can support a reversal scenario, especially if open interest falls. It is confirmation to investigate, not a standalone entry signal.
Pair the map with open interest. Price moving through a modelled cluster while OI drops is consistent with contracts being closed in aggregate, but it does not prove that the provider's exact cluster estimate was correct. If OI rises, new positions are being opened in aggregate and the positioning picture needs to be reassessed.
The three ways traders fool themselves
Trading the map instead of the market. The heatmap says nothing about trend, funding, or whether anyone wants the asset. It is one layer. A bright band in a market falling on real spot selling is not a target.
Assuming the map is live. Clusters build and clear continuously. A screenshot from four hours ago may describe a market that no longer exists.
Confusing brightness with a forecast. Worth repeating because it costs the most money: intensity is how much, never how likely.
Liquidation data describes positioning, not intent. It tells you where pain is concentrated. What price does with that information depends on everything else happening in the market.
Where to look at real maps
Formion tracks live liquidation-cluster estimates across major perpetual markets, alongside open-interest and funding context that helps assess whether a move coincided with position closures or new leverage. Same picture as above — with the numbers underneath it.
- A liquidation heatmap estimates where leveraged positions may be force-closed — it is a model, not exchange-published truth
- Brightness estimates magnitude at a level, never the probability price reaches it
- Forced activity can amplify a move after price reaches a zone, but the band is not a magnet or forecast
- Liquidation execution differs by venue and may include partial or backstop mechanisms
- Cross-check the map against open interest, spot volume, volatility and the venue's own liquidation rules
Primary mechanism reference: Hyperliquid liquidation documentation. Other venues may use different liquidation and backstop rules.
Trade these setups — don't just read about them.
See these signals live in the Formion trading terminal.
- Free to start
- No card required